Offsetting points in Stata marginsplot graphs
mplotoffset package: ssc install mplotoffset. Just replace your typical marginsplot command with mplotoffset instead. Within R, the marginaleffects package makes calculating predicted probabilities easy from all sorts of different models. It also makes graphing the results easy, producing good-looking plots by default. Relevant to this post, when plotting categorical predictions, the marginaleffects package slightly offsets the points from each other by default so that they're not plotted directly on top of each other — making interpretation far easier, in addition to being far more aesthetically pleasing.
In Stata, the margins command is also useful, capable, and easy. Following the margins command, the results also can easily be plotted with marginsplot. However, it does not offset points when plotting categorical predictions. Here is an (nonsensical) example of what I mean.
sysuse auto
mlogit foreign headroom
margins, at(headroom=(1(1)5))
marginsplot, plotdimension(headroom)
This default behavior is not great. First, as noted above, these points overlap and make the graph hard to read. Second, the connecting lines do not make sense for this type of graph. Third, this is going to be even more difficult to read if rendered in black and white in a journal article (and likely for those with forms of colorblindness).
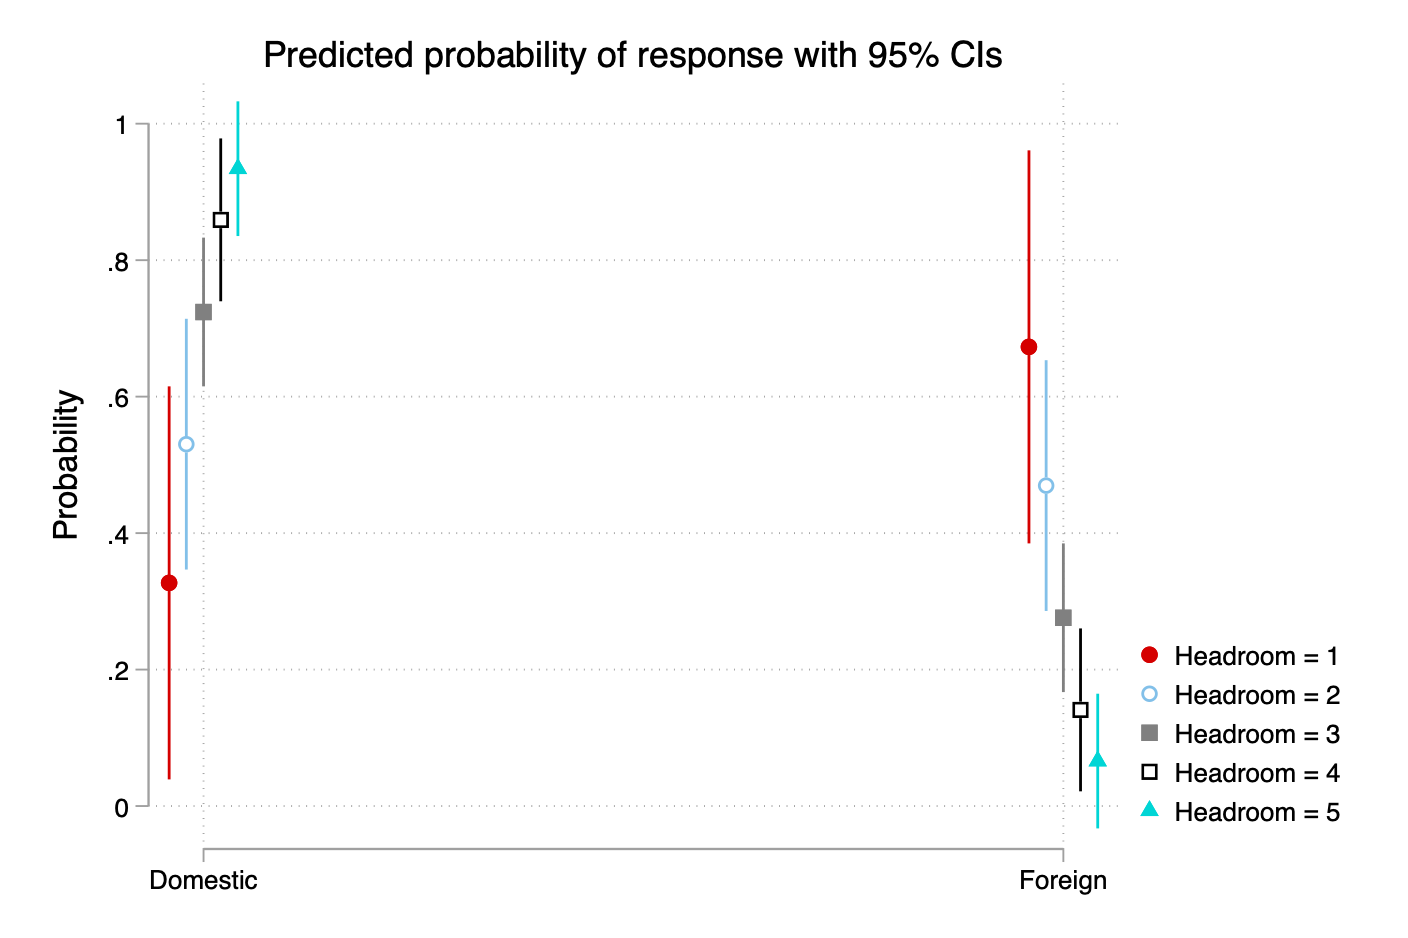
There are no straightforward options in marginsplot to change this overlap behavior. Thanks to Clyde Schechter on Statalist, I learned a solution that I wanted to document here for others. The logic of the solution is to save the results from margins, load those in a separate frame, and manually recreate the graph of the results to your liking.
In addition to solving the overlapping points issue, I'm going to use the cleanplots scheme. This theme (which Stata calls schemes) produces aesthetic graphs that render equally well in color as black and white and are colorblind friendly.
net install cleanplots, ///
  from("https://tdmize.github.io/data/cleanplots") replace
Now with the scheme installed, we can get to work on improving the graph above.
clear all

set scheme cleanplots

sysuse auto

tempfile plot

mlogit foreign headroom
margins, at(headroom=(1(1)5)) saving(`plot')

frame create plot // re
frame change plot
use `plot'

gen foreign = _predict + (0.02*(_at - 3))

graph twoway ///
  (rspike _ci_lb _ci_ub foreign if _at == 1, ///
    xlabel(1 "Domestic" 2 "Foreign") lcolor(red*1.2) ///
	ytitle("Probability") xtitle("") ///
	title("Predicted probability of response with 95% CIs") ///
	legend(order(2 4 6 8 10)) ///
	legend(label(2 "Headroom = 1")) ///
	legend(label(4 "Headroom = 2")) ///
	legend(label(6 "Headroom = 3")) ///
	legend(label(8 "Headroom = 4")) ///
	legend(label(10 "Headroom = 5"))) ///
  (scatter _margin foreign if _at == 1, ///
    msymbol(circle) mcolor(red*1.2)) ///
  (rspike _ci_lb _ci_ub foreign if _at == 2, lcolor(eltblue)) ///
  (scatter _margin foreign if _at == 2, msymbol(circle) ///
    mfcolor(white) mcolor(eltblue)) ///
  (rspike _ci_lb _ci_ub foreign if _at == 3, lcolor(gs8)) ///
  (scatter _margin foreign if _at == 3, ///
    msymbol(square) mcolor(gs8)) ///
  (rspike _ci_lb _ci_ub foreign if _at == 4, lcolor(black)) ///
  (scatter _margin foreign if _at == 4, ///
    msymbol(square) mfcolor(white) mcolor(black)) ///
  (rspike _ci_lb _ci_ub foreign if _at == 5, color(cyan*1.2)) ///
  (scatter _margin foreign if _at == 5, ///
    msymbol(triangle) mcolor(cyan*1.2))
Much, much better.
